1. What is this solution?
The MIPV (Mobile Integrated Photovoltaic) solution uses solar panels to supplement the vehicle’s battery charging. We assess the panel kit, mounting and charging-system compatibility for the particular vehicle. Output depends on light levels, the season and the installation.
2. Why install it?
E. Lower deep-discharge risk — solar charging can help reduce this risk when system capacity suits the demand. It does not replace battery diagnosis or necessary charging.
F. Fleet improvement — for businesses seeking to reduce auxiliary energy costs and fuel-related emissions, solar panels can be one option worth assessing.
After installation, the Mipv.pro app lets you view the charge controller’s data and follow the system’s performance.
The app displays power in watts (W), energy in kilowatt-hours (kWh), estimated CO2 savings, battery voltage in volts (V) and charging current in amperes (A). It also supports groups of vehicles.
Which vehicles benefit most?
Results vary with the vehicle’s location and the driver’s habits. A vehicle regularly travelling on sunny routes, for example in Italy, France, Spain or Portugal, may benefit more than one operating with less sunlight. The actual result also depends on how the system is used.
Electrical demand also matters. Laptops, phones, refrigerators and other equipment draw on the batteries; solar panels can help recharge them and cover part of that demand. We assess the equipment and operating pattern individually, without promising that solar energy alone will power every appliance continuously.
Possible benefits depend on the installation and operating conditions:
- Fuel use may be reduced, depending on vehicle operation;
- Lower fuel consumption can reduce associated CO2 emissions;
- Energy required from the alternator may decrease in suitable conditions;
- Solar charging can help maintain battery charge levels;
- The risk of deep discharge and related downtime may be reduced.
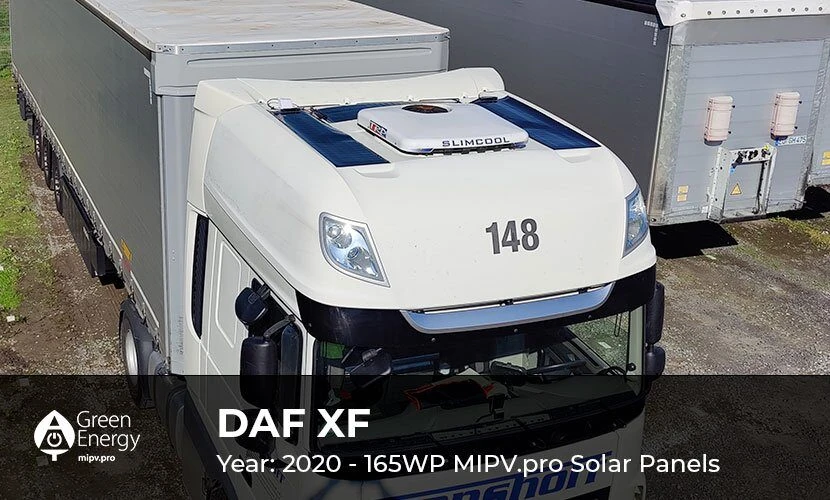
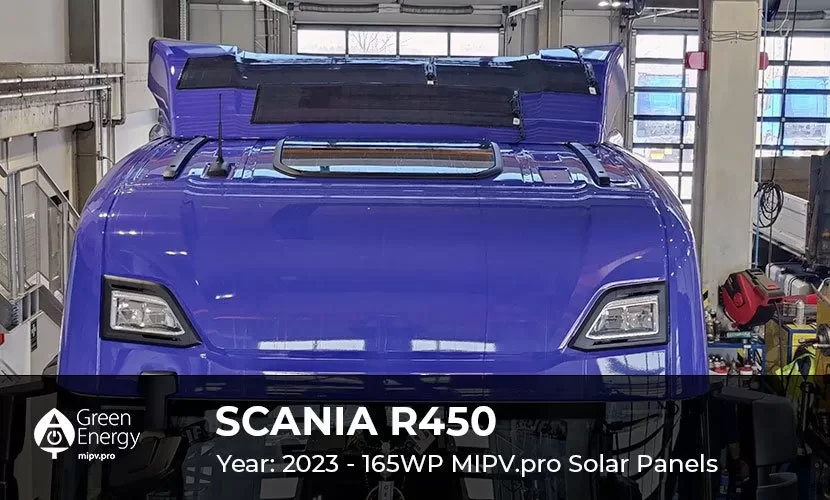
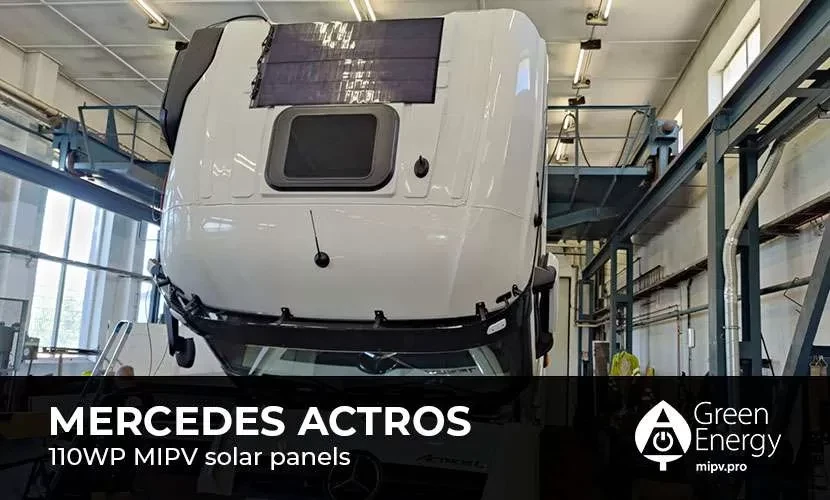
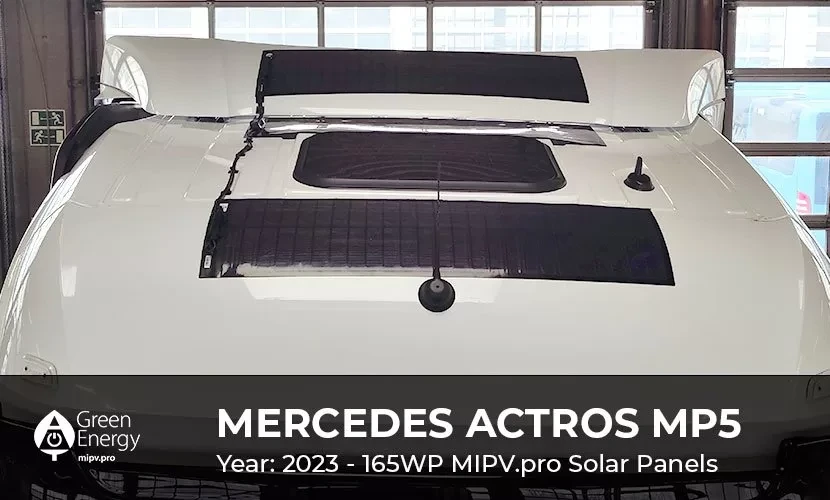
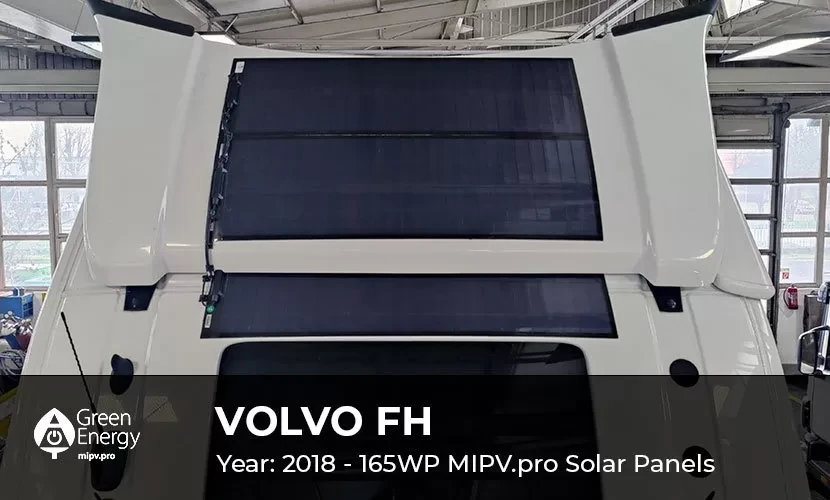
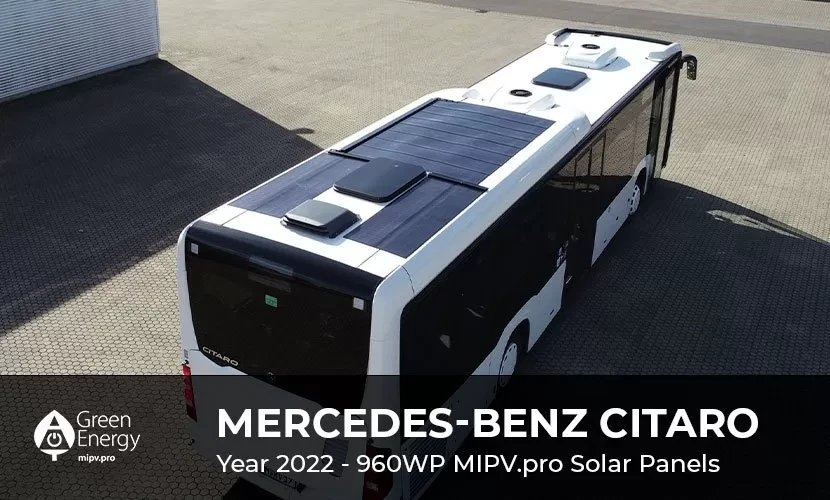
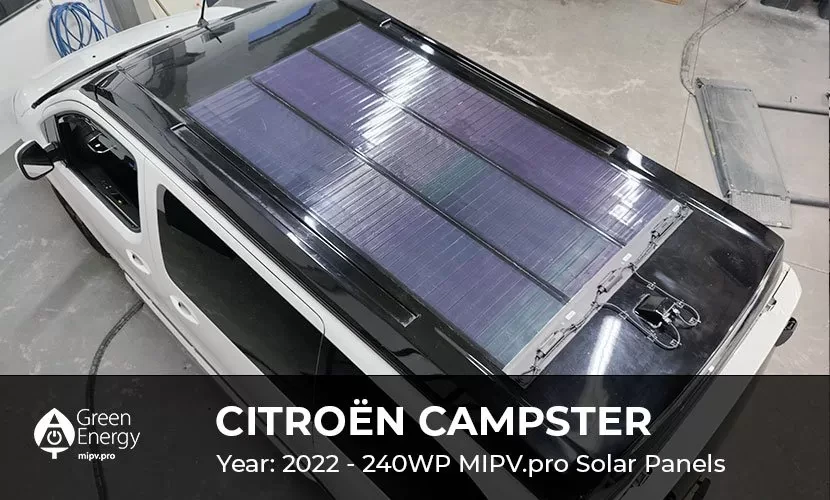
What does it look like in real life?






Cost comparison for a truck
Client A:
The previously published Customer A example compares August and September 2022; its table reports 99 litres less fuel used while idling in September. Its annual projection was about 700 litres of fuel and 1.87 t CO2, allowing for lower winter output. This is not an annual measurement verified here or a promise for another vehicle.
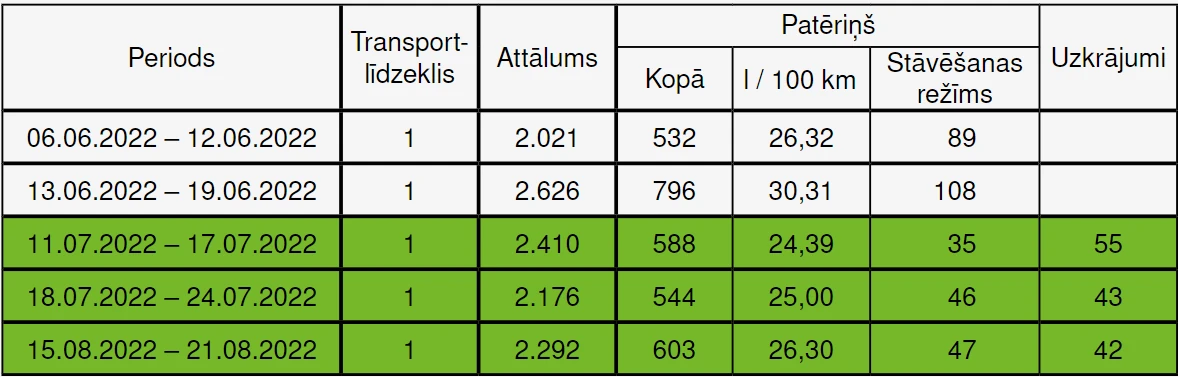
The previously published Customer B example contains weekly data from June–August 2022. Its table reports 42 litres saved while idling for 15–21 August 2022, the lowest saving among the weeks shown. Its annual projection was 500–700 litres of fuel and 1.37–1.87 t CO2. This is a historical projection, not an individual calculation for your vehicle.
The potential benefits described above should be assessed alongside the vehicle’s actual operating data.
- Fuel use may be reduced, depending on vehicle operation;
- Lower fuel consumption can reduce associated CO2 emissions;
- Energy required from the alternator may decrease in suitable conditions;
- Solar charging can help maintain battery charge levels;
- The risk of deep discharge and related downtime may be reduced.
Cost comparison for the bus
Client C: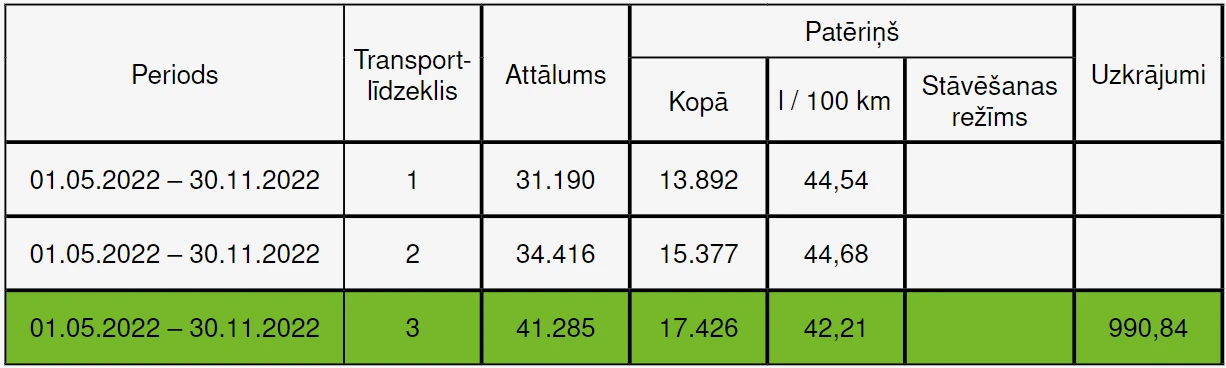
The previously published bus example covers 1 May–30 November 2022. The material’s stated savings calculation is 2.4 l/100 km and 990.84 litres of fuel. Its annual projection, allowing for lower winter output, was about 1,400 litres and 3.75 t CO2. The table alone does not establish applicability to another bus; the vehicle and comparable operating conditions must be assessed.
The potential benefits described above should be assessed alongside the vehicle’s actual operating data.
- Fuel use may be reduced, depending on vehicle operation;
- Lower fuel consumption can reduce associated CO2 emissions;
- Energy required from the alternator may decrease in suitable conditions;
- Solar charging can help maintain battery charge levels;
- The risk of deep discharge and related downtime may be reduced.